Inflation is a hot topic at the moment and the impact of the last twelve months of high prices has announced it’s presence in the charts presented at our Forward Planning Meetings with our clients.
For some time now, we have focused our backward looking portfolio reporting on inflation linked return assumptions, as it is these which we use in our forward looking projections in our financial planning and cashflow forecasting. It makes sense when you think about it. Because it is the delivery of the returns which the financial plan needs which is most important. Comparisons with market indices, or performance versus other managers, trails a distant second as far as we are concerned.
I got into an interesting conversation last week with fellow bdb investment committee members Anick and Andrew about it all and I observed that it was the first time in my 20 year career (and Andy’s 30 year!) that inflation had been so high. It prompted us to delve into the records to see what we could learn from the last time we had such conditions and I thought it might be of interest to share our findings.
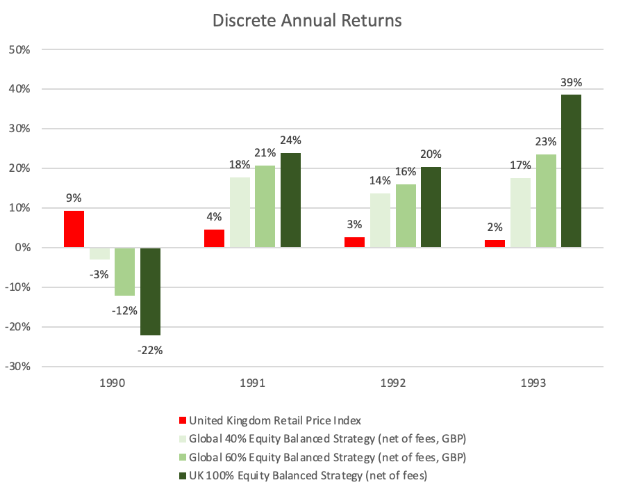
The following chart shows portfolio returns and inflation as measured by RPI during the early nineties.
It can be seen that we have to go back to 1990 to find inflation numbers as high as those we observe today. In that year, RPI was as high as 9% (the previous years were 8% and 7%!) and was accompanied by a market fall of 22% following Iraq’s invasion of Kuwait which can be seen in the chart below. A double whammy to the spending power of portfolios which must have been a worrying time.
Whilst we obviously don’t know what the future holds (you might have heard this from us before). As we speak, our portfolios have held up well when the last twelve months are considered.
The main challenge the current conditions throws at us as planners and investment advisors is the classic question ‘is it different this time?’. In other words, is there something about the current economic and market situation which makes us question our beliefs about investing or the assumptions on returns we have used in constructing our clients’ plans.
The short answer to this question is no. I think this little data set of only a handful of years helps to show why.
In the few years that followed 1990, investors were delivered three years of spectacular return. By the end of 1993, portfolios across the risk spectrum had well outstripped long term inflation linked expectations even after including the impact of this one bad year.
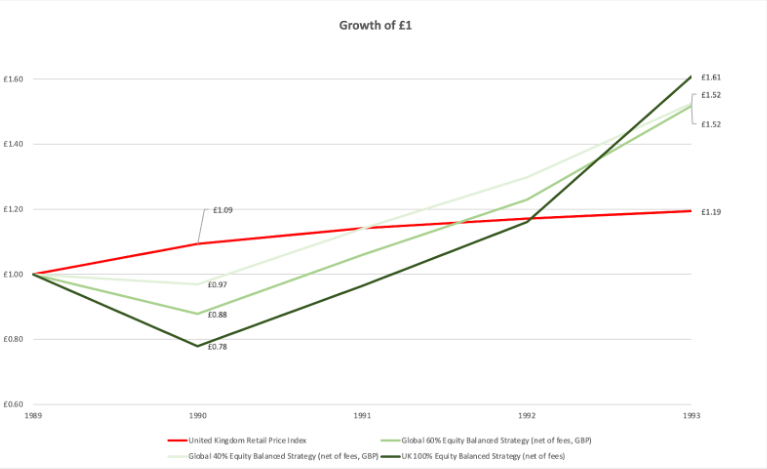
Whilst it can look and feel dramatic at the time when faced with market falls or inflation spikes, it is only when we look through the lens of long term compound returns that we can find some real context.
Our long term return assumptions are just that. They are born from the study of long term data, not what might be going on from one month (or even year) to the next. We come back to charts like the one below which contain so many shorter periods which will have given cause for concern, whether that is a market crash, or inflation spike.
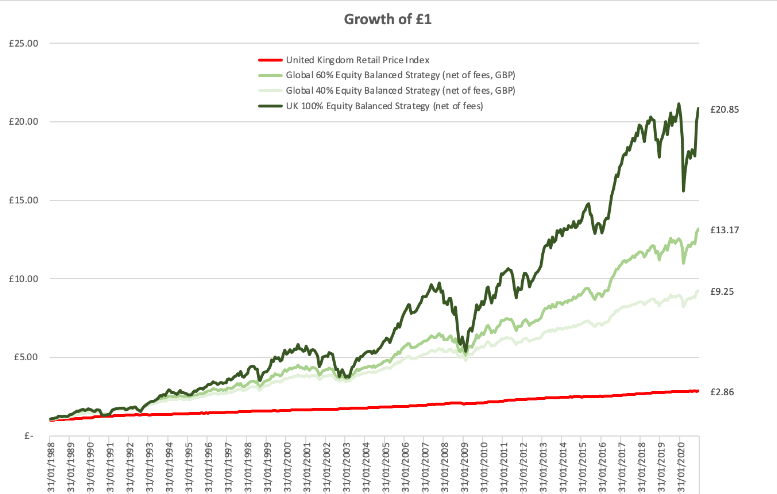
Inclusion of stocks and shares in your portfolio provides the best hedge against inflation in the long term. The more you have, the more protected you are likely to be from inflation (if you can afford to be patient enough). Stocks are not a panacea though. More stocks means a more rocky ride in the short term, and a greater probability you don’t get what you need over the time frame you need it. Helping our clients understand how best to balance these two contrasting factors is one of the most important and valuable things we do as planners.
Our conclusion from looking back at the history books will be a familiar one. It may feel uncomfortable right now, but it will take a much longer period of existing conditions prevailing before the fundamentals which underpin our philosophy and assumptions are overhauled.
Evidence based investing is a science. Rigorous scientific investigation requires the study of large data sets before reliable conclusions can be drawn. We believe it is healthy to continually challenge our beliefs and conclusions, but at present, the data still reinforces our approach.
Data Source: Dimensional Returns Web
Posted by: Aaron Walker | Posted in: News